2025 annual report

Uptake
results

Here we share Regenagri's 2025 uptake data methodology and top level results.
New shoots on a tea bush catching the light, with forest blurred behind
additional hectares under the regenagri programme in 2025, bringing the total to 2,307,642
+320,402
conservation area, % of total land in the programme
18%
Additional supply chain companies certified to Regenagri supply chain standards in 2025, bringing the total to 2,278
+1,017
This data looks at the uptake of the Regenagri programme in terms of hectares of land covered, the number of farms that have adopted our standards, and the split across countries, regions, types of produce and conservation land during 2025.  

Uptake data

The data comes from third-party audits carried out during 2025. The Regenagri programme requires all certified organisations to be audited annually.  Farm or project-specific data are then aggregated to calculate results at country and global level.

2025 data are compared with 2024 figures to provide quantification of change, expressed as absolute value or percentage. When values are missing, it means either that no farms or companies were part of the Regenagri programme in that country, or that the data was not yet available or verified, at the time of writing this report.

Regenagri requires a thorough data and process integrity check, starting from application to issuance of final data, as detailed at the end of this page.

Where our standards are being used

The Regenagri standards are in use all over the world.
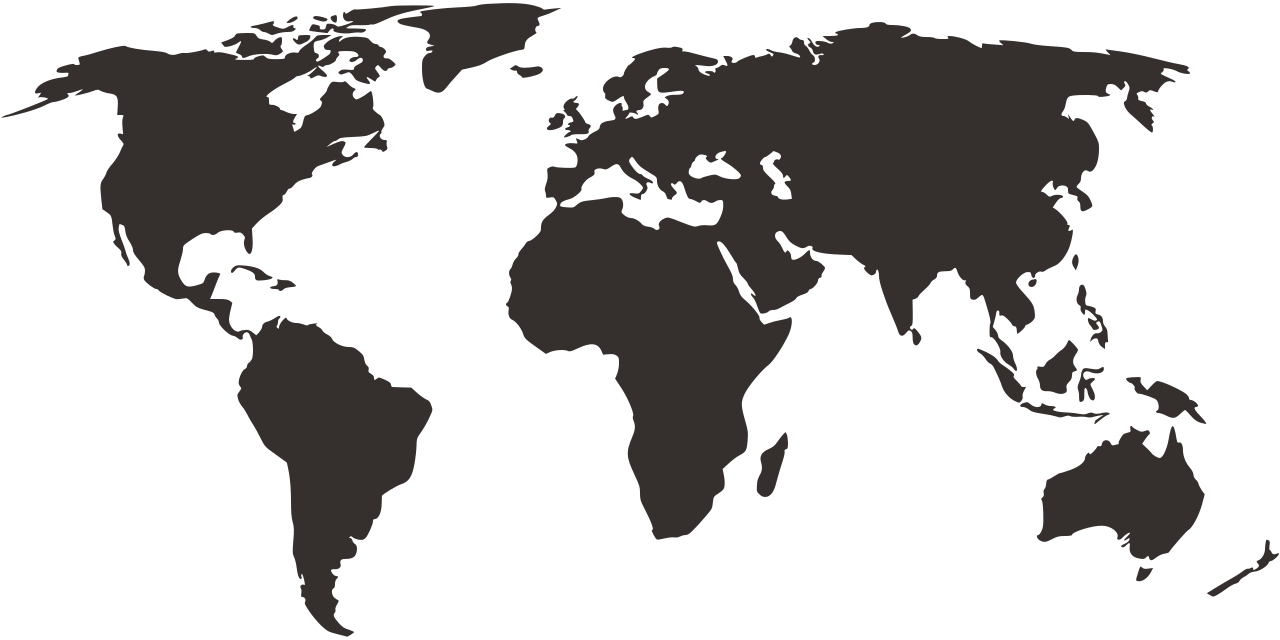
Outline world map showing all continents in silhouette

S America

Total area: 521,922 Ha

Brazil

Peru

N America

Total area: 245,489 Ha

Mexico

USA

Europe

Total area: 19,245 Ha

France

Greece

Italy

Spain

UK

Asia

Total area: 751,822 Ha

Bangladesh

India

Malaysia

Pakistan

Sri Lanka

Taiwan

Tajikistan

Türkiye

Australasia

Total area: 366,641 Ha

Australia

Africa

Total area: 402,523 Ha

Côte d'Ivoire

Egypt

Nigeria

Tanzania

Crop type

The Regenagri assessment is not crop specific. Instead, all crops farmed by a particular farm are included in the annual assessment and in the scope of farm certification.

In this report we feature a small sample of the large variety of produce grown under the Regenagri programme. We focus on the following crops as the principal crops of interest for farms and supply chain operators:  
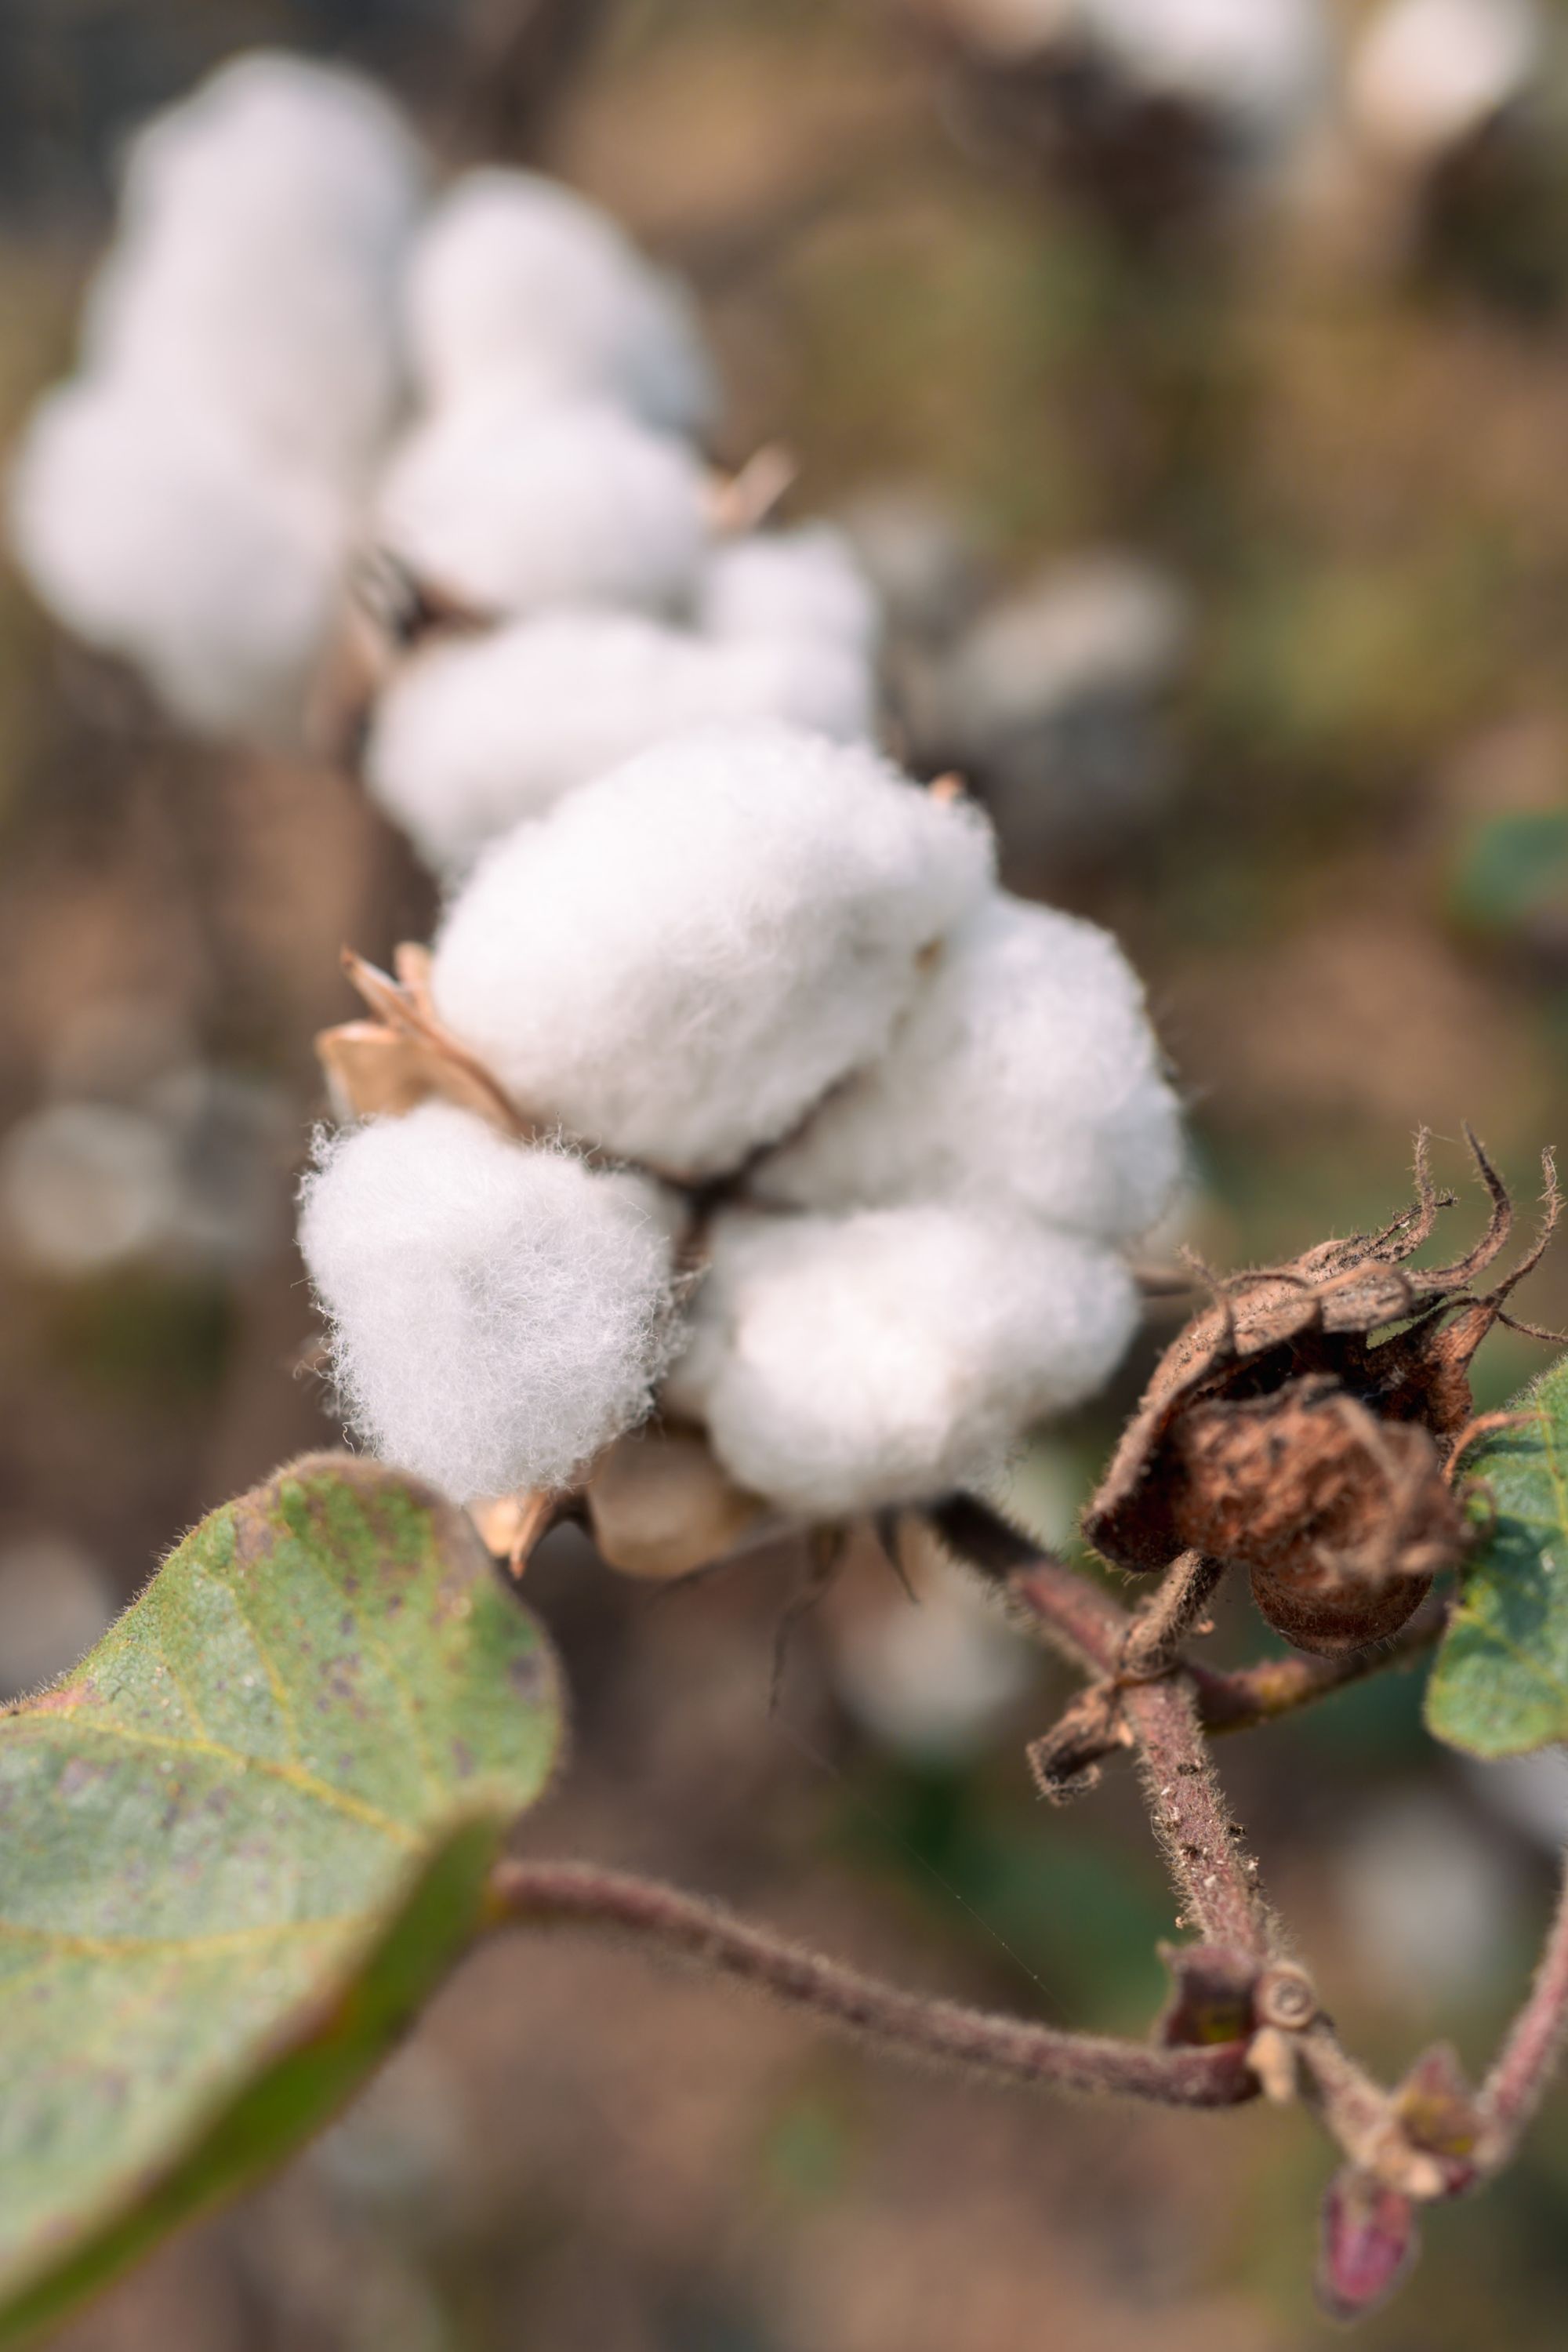
  • Cotton: The most common crop grown within our programme. This is farmed in rotation with other arable crops such as maize, wheat and soya bean. All crops in rotation are assessed and included in the scope of certification.
  • Coffee: The second most common crop grown within our programme.
  • Nuts  
  • Tree fruits  
  • Rice
  • Sugarcane  
  • Tea  
  • Soya bean and grains (corn, wheat and others)
  • Spices, fruits and vegetables
  • Rubber
  • Palm
  • Livestock, sheep and wool

Uptake results

Farms and supply chains
By the end of 2025, 316,563 farms were under the Regenagri programme, a 4.78% decrease compared to 2024 (332,456 farms). This is due mostly to the fact that some smallholder projects have been replaced by fewer but bigger farms (see below: Hectares under Regenagri).

1,017 additional supply chain companies were certified to the Regenagri supply chain standards by the end of 2025. This represents a significant increase of 80.71% on 2024 figures, bringing the total number of supply chain companies in the programme to 2,278.

The increase in certified supply chain companies represents the growing demand and use of Regenagri-certified products by brands.
Hectares under Regenagri
2,307,642 hectares were under the Regenagri programme by the end of 2025, a 16.12% increase on the previous year (1,987,240 hectares).

The country with the largest area under Regenagri is India, followed by Brazil, Australia, Côte d’Ivoire, and the United States.
Conservation area
Of the area under the programme, 18% was dedicated to conservation, an increase of two percentage points from 16% in 2024.

These areas encompass a wide spectrum of natural environments from hedgerows and windbreaks to undisturbed forests and grasslands – all of which are encouraging ecosystems to thrive and helping to restore ecological balance.

It is hugely encouraging to see such a notable conservation area, a testament to Regenagri-certified farms’ ongoing commitment to safeguarding biodiversity.
Table: No of hectares under the Regenagri programme by country
Country
Hectares
Total
2,307,642
Australia
366,641
Brazil
456,586
China
14,985
Côte d'Ivoire
256,915
Egypt
1,012
France
175
Greece
11,721
India
487,185
Italy
219
Mexico
18,651
Mozambique
700
Pakistan
40,514
Peru
15,336
Spain
6,630
Sri Lanka
15,158
Taiwan
64
Tajikistan
24,701
Tanzania
135,607
Türkiye
111,927
Uganda
767
United Kingdom
500
Uruguay
50,000
USA
226,838
Uzbekistan
56,276
Zambia
8,534

Cotton uptake

metric tonnes of Regenagri cotton lint produced in 2025
2.1m
hectares of Cotton under the Regenagri programme
2,128,496
production data

Cotton

Cotton under the Regenagri programme covered a total of 2,128,496 hectares globally in 2025, an increase of 57.64% from 1,350,252 hectares in 2024.

Regenagri cotton production spans 19 countries. Australia is the leading producer by volume, followed by Brazil, India, Türkiye and the United States.

Please note: Regenagri’s upcoming Life Cycle Assessment (LCA), conducted by an independent third party to complement the data provided in the 2025 Annual Report, will provide GHG emission data and emission factors for cotton at both country and global levels.

Table: Cotton uptake and production
Country
Hectares (Ha)
Conservation area
Average yield
(MT/Ha)
Cotton lint (MT)
Total
2,128,496
2,135,335
Australia
355,991
34%
6.31
578,198
Brazil
378,681
27%
5.15
553,703
China
14,985
5%
5.02
27,871
Côte d'Ivoire
256,915
4%
1.19
113,988
Egypt
1,012
5%
4.50
1,687
Greece
11,721
8%
2.55
10,724
India
477,549
3%
1.82
328,795
Italy
23
8%
1.00
9
Mexico
18,651
22%
2.92
16,567
Mozambique
700
0%
0.85
232
Pakistan
40,514
14%
1.96
26,519
Peru
3,850
13%
0.88
1,143
Spain
6,525
39%
2.66
4,102
Tajikistan
24,701
16%
4.00
32,368
Tanzania
135,607
47%
0.77
21,533
Türkiye
109,423
3%
4.95
203,953
USA
226,838
19%
1.76
125,807
Uzbekistan
56,276
11%
4.45
86,924
Zambia
8,534
30%
0.46
1,212

Coffee uptake

metric tonnes of Regenagri green coffee produced in 2025
249,812
hectares of coffee under Regenagri’s programme in 2025
79,141
Coffee cherries in red, yellow and green spread out in a deep layer to dry
Production data

Coffee

Spanning 79,141 hectares in total by the end of 2025, the vast majority of Regenagri’s coffee-growing land is located in Brazil’s Cerrado Mineiro region, followed by India, Sri Lanka, and Uganda.

The reach of our coffee programme is largely due to coffee brands and retailers such as illycaffè, MaxiCoffee, and other coffee supply chains adopting our standards.

Please note: Regenagri’s upcoming Life Cycle Assessment (LCA), conducted by an independent third party to complement the data provided in the 2025 Annual Report, will provide GHG emission data and emission factors for coffee at both country and global levels.

Table: Coffee uptake and production
Country
Area (Ha)
Harvest (tons)
Total
79,141
249,812
Brazil
73,835
249,296
Uganda
985
156
India
3,125
360
Sri Lanka
1,196
1
Table: Uptake of other crops
Crop
Total area (Ha)
Tea
17,936
Nuts
280
Sheep/wool
60,650
Sugar cane
6,300
Fresh produce/citrus
3,264
Rubber
750
Palm
11,486
Soybean (grown in rotation with other crops)
153,550
Maize (grown in rotation with other crops)
380,832
Rice (grown in rotation with other crops)
11,365
Wheat (grown in rotation with other crops)
437,077
Sunlit tea shoots beaded with water, filling the frame in yellow-green
Production data

Tea

We have continued to see strong growth in the adoption of Regenagri standards among tea producers, particularly in India and Sri Lanka. By the end of 2025, a total of 17,936 hectares of tea-growing land were Regenagri-certified.

This expansion has been supported by two key collaborations: our local partner, Solidaridad Asia, has helped us extend our reach across the tea sector in India, while our participation in the Asia Tea Alliance has broadened our engagement with producers across the region.

Rubber

Rubber production grew steadily in 2025 following the certification of the first Regenagri-certified rubber producer in Sri Lanka. By the end of the year, our standards covered 750 hectares of rubber production.

Looking ahead, we are working on expanding Regenagri rubber certification in Thailand.

Grains, soya bean and rice

Grains (mostly wheat and maize), soya bean and rice represent a large part of the total Regenagri programme, and are often in the same crop rotation systems.  

Soya bean and cereals are usually grown in rotation with cotton. In 2025, soya bean production totalled 153,550 hectares, grains (wheat and maize) 815,909 hectares, and rice 11,365 hectares.

A shallow river running between tall forest trees, with ivy-covered trunks on the bank
Biodiversity

Conservation land

Conservation and biodiversity are important elements of Regenagri’s criteria.

Our programme aims to drive an increase in land dedicated to conservation, which we’re pleased to report we did successfully in 2025, with 18% of all land covered by Regenagri standards now used for conservation (an increase of two percentage points from 16% in 2024).

Close-up cross-section of red-brown crumbly soil threaded with fine pale roots, Nagpur, India
data and process integrity check
Application and eligibility review
Applicants submit their application for review by the Regenagri team. This includes verification of eligibility criteria, including a strict non-deforestation policy and a risk assessment that evaluates environmental and social factors.

Those failing to meet the baseline standards, due to legal violations or breaches of environmental and social standards, will not be permitted to join the programme.
Certification body assessment
Eligible applications are passed on the independent third-party certification body , Control Union, for review and to complete certification contracts. This phase includes audit preparation, where farms are given detailed instructions to prepare for the audit.

On-site audit and data review: Auditors collect and verify farm data and supporting evidence, ensuring this aligns with Regenagri’s criteria and procedures.

Verification: A separate verifier ensures the data and documentation meet Regenagri standards, including procedural, administrative and data integrity aspects.

After the verification is completed, the certification body takes the certification decision based on the outcome of the audit and provides the clients with the audit report and – if the requirements are met – with the certificate.
Final review and certification
The verified data are submitted for registration by Regenagri.

The data are also analysed against regional statistics. Any inconsistencies or gaps in the information are addressed by the certification body before the final Regenagri report and certificate are issued.

After certification, farms must commit to annual audits and meet the given continuous improvement targets to remain certified.

Next...

Read about the progress made by Regenagri-certified Brazilian coffee farms in 2025.